

We've made it even easier for site selectors and potential investors to visualize critical business and industry data on ZoomProspector, with the new addition of smart bubbles for states, provinces and other large regions. This update means website users can instantly make sense of the density of businesses over large geographies, as you can see in the image below of the Empire State Development ZoomProspector tool.
This is a pretty big deal because it makes the business and industry reports in GIS Planning - already the most powerful in the industry - even easier to use for data storytelling in very large regions. No other vendor includes daily updated data to list, map, analyze and share all the businesses in your region by industry. No one else lets you easily drill down into target sectors and clusters by NAICS code, list and map the actual businesses by name, view the total figures for sales and number of employees by category.
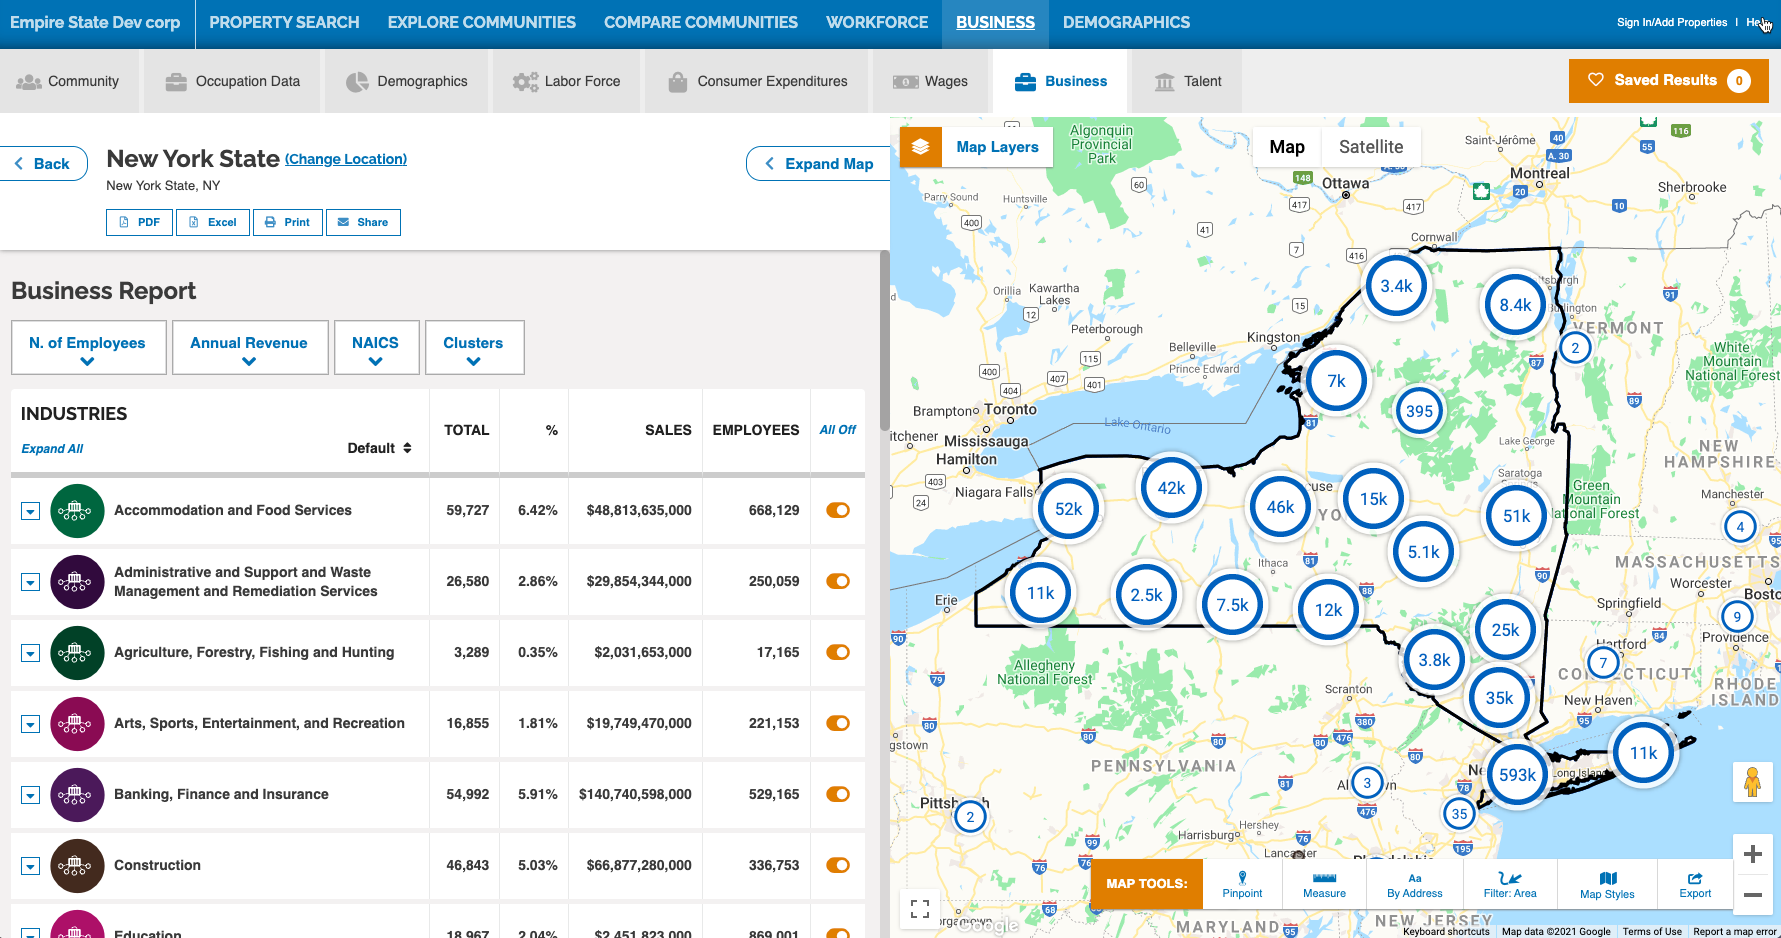
This update addresses the user experience specifically for ZoomProspector clients such as states and large regions, where there are so many businesses it can be hard to see them on the map as anything other than a tapestry of color-coded dots. Since 30 statewide EDOs and utilities in the US have selected GIS Planning as their data tool of choice, we take this responsibility very seriously. The smart bubbles add up the total sales of companies in any given region. As you click on the map zoom, they will get broken down into smaller increments of dots and then the color-coded business dots denoting an individual business.
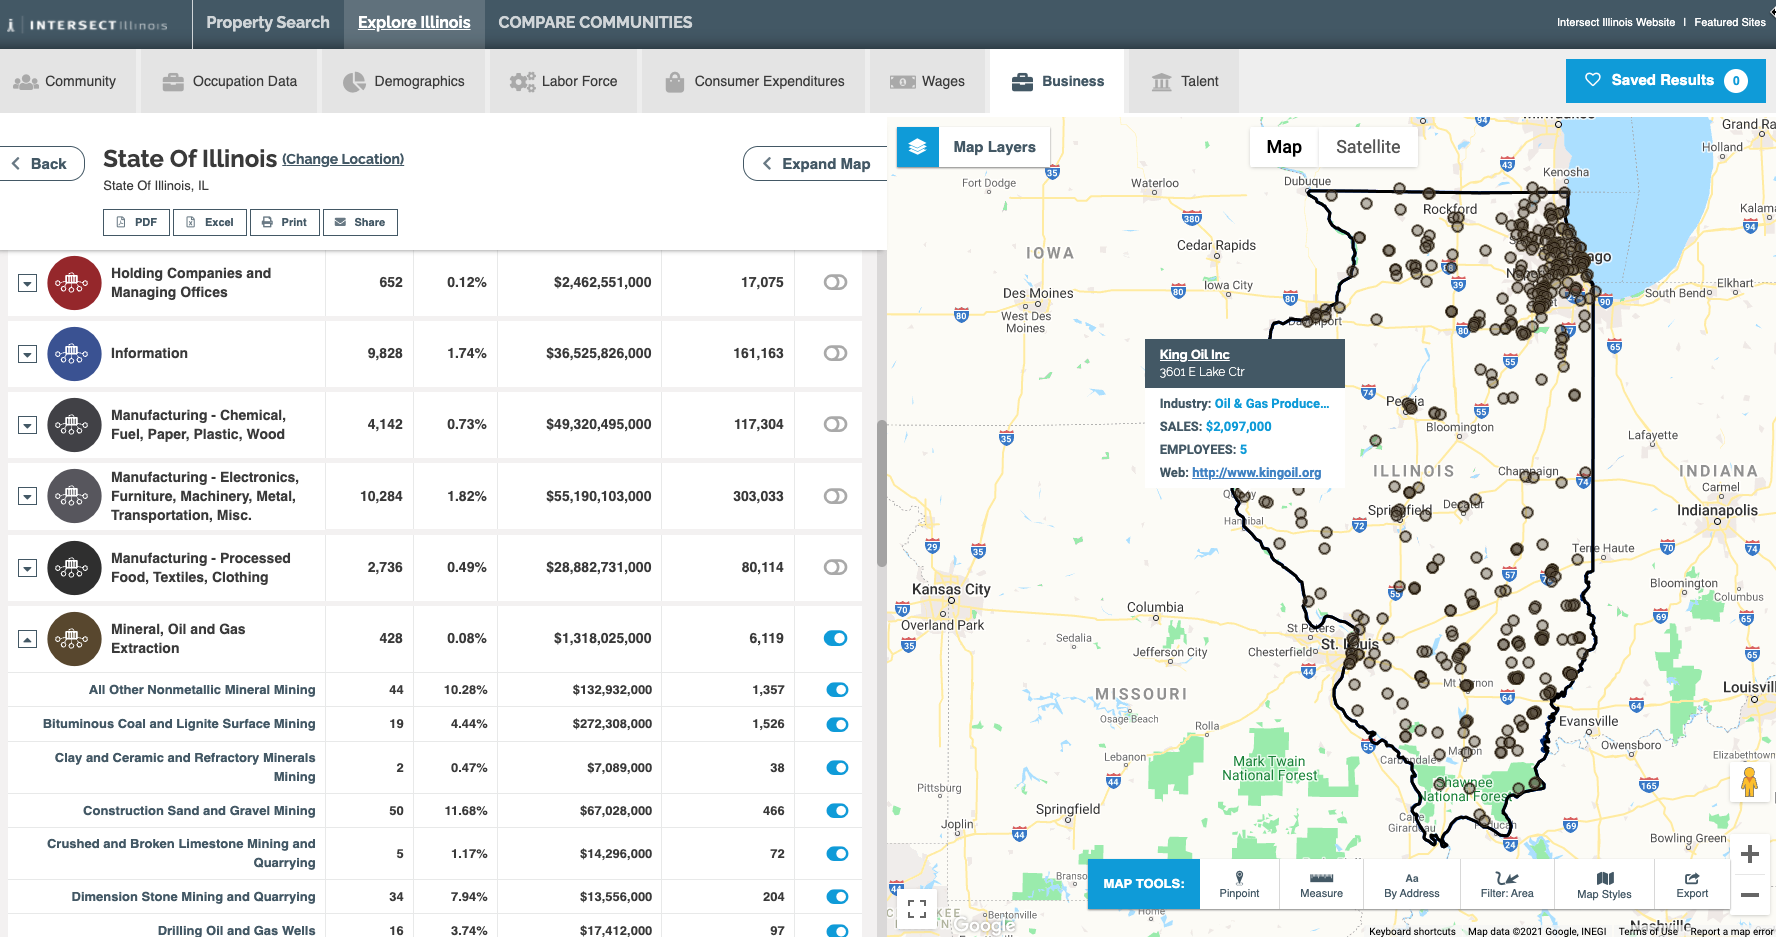
The smart bubble sales totals in this business and industry total also get broken down into the color-coded business dots if a website visitor chooses to toggle one of the categories at a time. In the image below, you can see how we have chosen to display only one NAICS category on the Intersect Illinois ZoomProspector tool.
Updates to user interface like this are just one of the many reasons ZoomProspector remains the industry's leading GIS data web tool for corporate site selection and economic development. If you'd like to learn more about how GIS Planning can help drive more investment to your community, schedule your demo with the button below.