
Back in December, we showed you several ways you can use our online data tools to showcase the Opportunity Zones in your community, regardless of whether you use our GIS sites and buildings database. We've had tremendous response to that post, as economic developers, municipal, county and state governments work to ensure they can attract investment to these newly created incentive zones. Now we have one more easy way for you to put those Opportunity Zones in front of investors using our Mapping Intelligence Component. You can learn about these different options in the video recording of this free, 30-minute Opportunity Zone webinar from January.
In case you need a reminder, Opportunity Zones were created to direct long-term capital into low-income communities across the U.S., with tax incentives designed to attract private investment into designated census tracts through privately- or publicly-managed investment funds. The zones are urban, rural, and suburban census tracts that are either high in poverty or border high-poverty areas.
You have a variety of ways to showcase these zones (and, if you choose, the commercial properties available in those zones), whether you are a client of ours or not. Some of these options are available even if you are using another GIS sites and buildings software vendor. Click here to view the video recording of this free, 30-minute webinar from January.
You can add an Opportunity Zones layer to your current full edition ZoomProspector Enterprise tool, add it as a search filter, feature special Opportunity Zone banners or icons on eligible properties, create a dedicated Opportunity Zone property viewer. These features are outlined in this blog post. Now you can also illustrate the zones on our interactive, stand-alone Mapping data tool, which can be embedded on any website page.
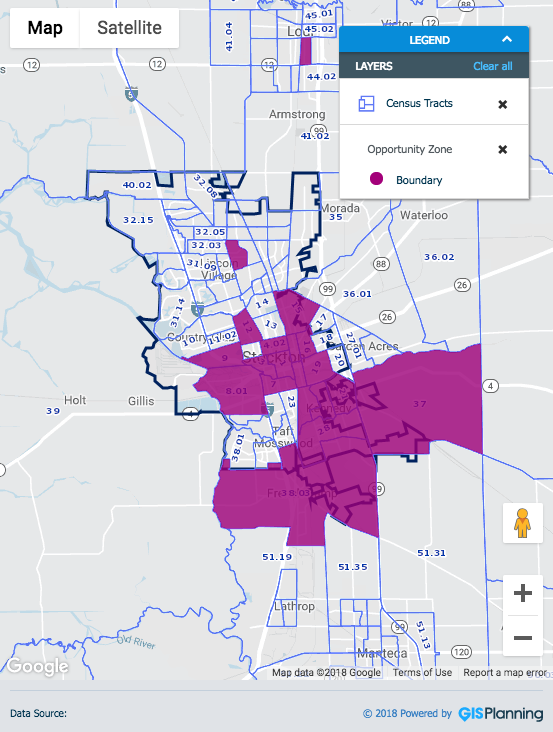
This Smart Mapping Intelligence Component can easily be customized to load up with your Opportunity Zones highlighted. We have the data ready to go (though you can also add in local data if you choose). Our six extremely affordable Intelligence Components can be purchased one at a time or as a suite, and can be embedded on any of your existing website pages with the click of a mouse. You can see a customized version of this on the Stockton website (note that they chose to remove heat maps). Click here to book a demo for your community.
Opportunity Zones showcased in our Smart Mapping Intelligence Component have the following features:
- Can be embedded on your website no matter what GIS sites and buildings vendor you use
- Mobile responsive
- Census track data
- Heat map data (at block group level)
- Option to add your own local data as layers
- Extremely affordable
- Have it up and running within one week