

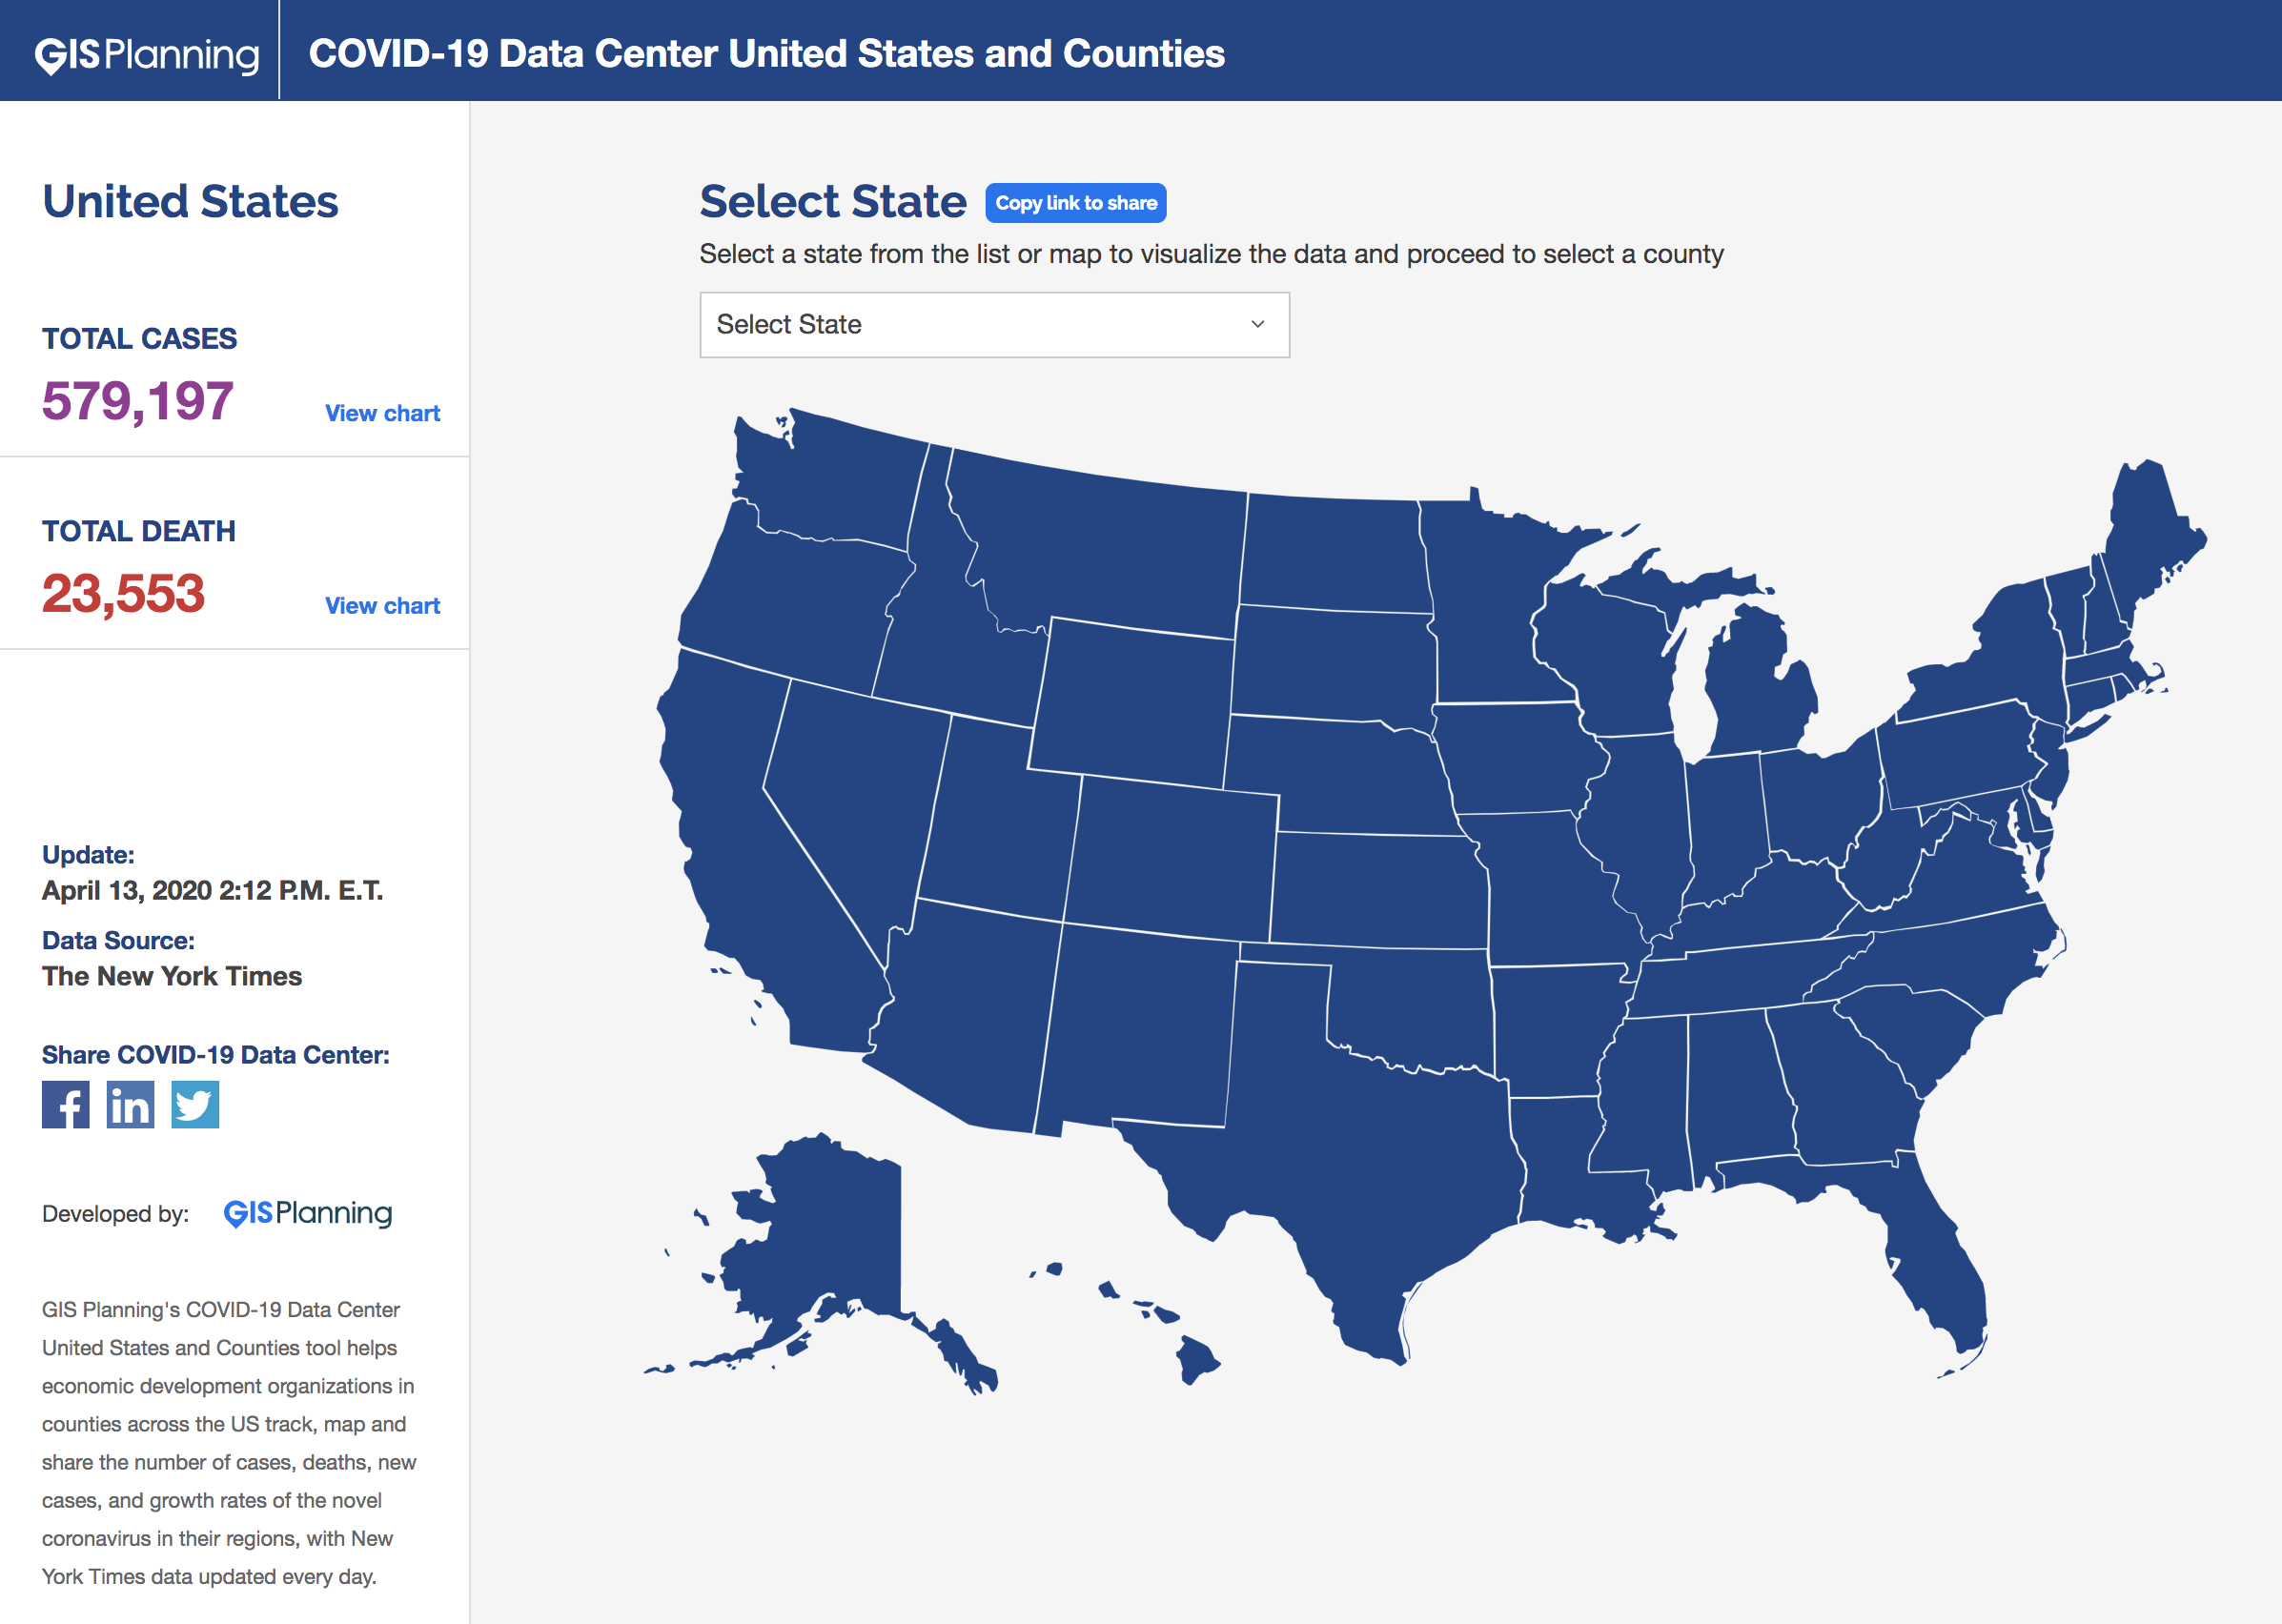
We are proud to announce this week's release of a new COVID-19 Data Center for the United States and Counties. The interactive mapping and data visualization tool can be found at this link here and in the Admin section for all of GIS Planning's ZoomProspector clients.
The COVID-19 Data Center for clients in the United States shows the map for the country and a drop down menu for each state, with daily updated data from the New York Times. Date and time for the data is also displayed on the left.
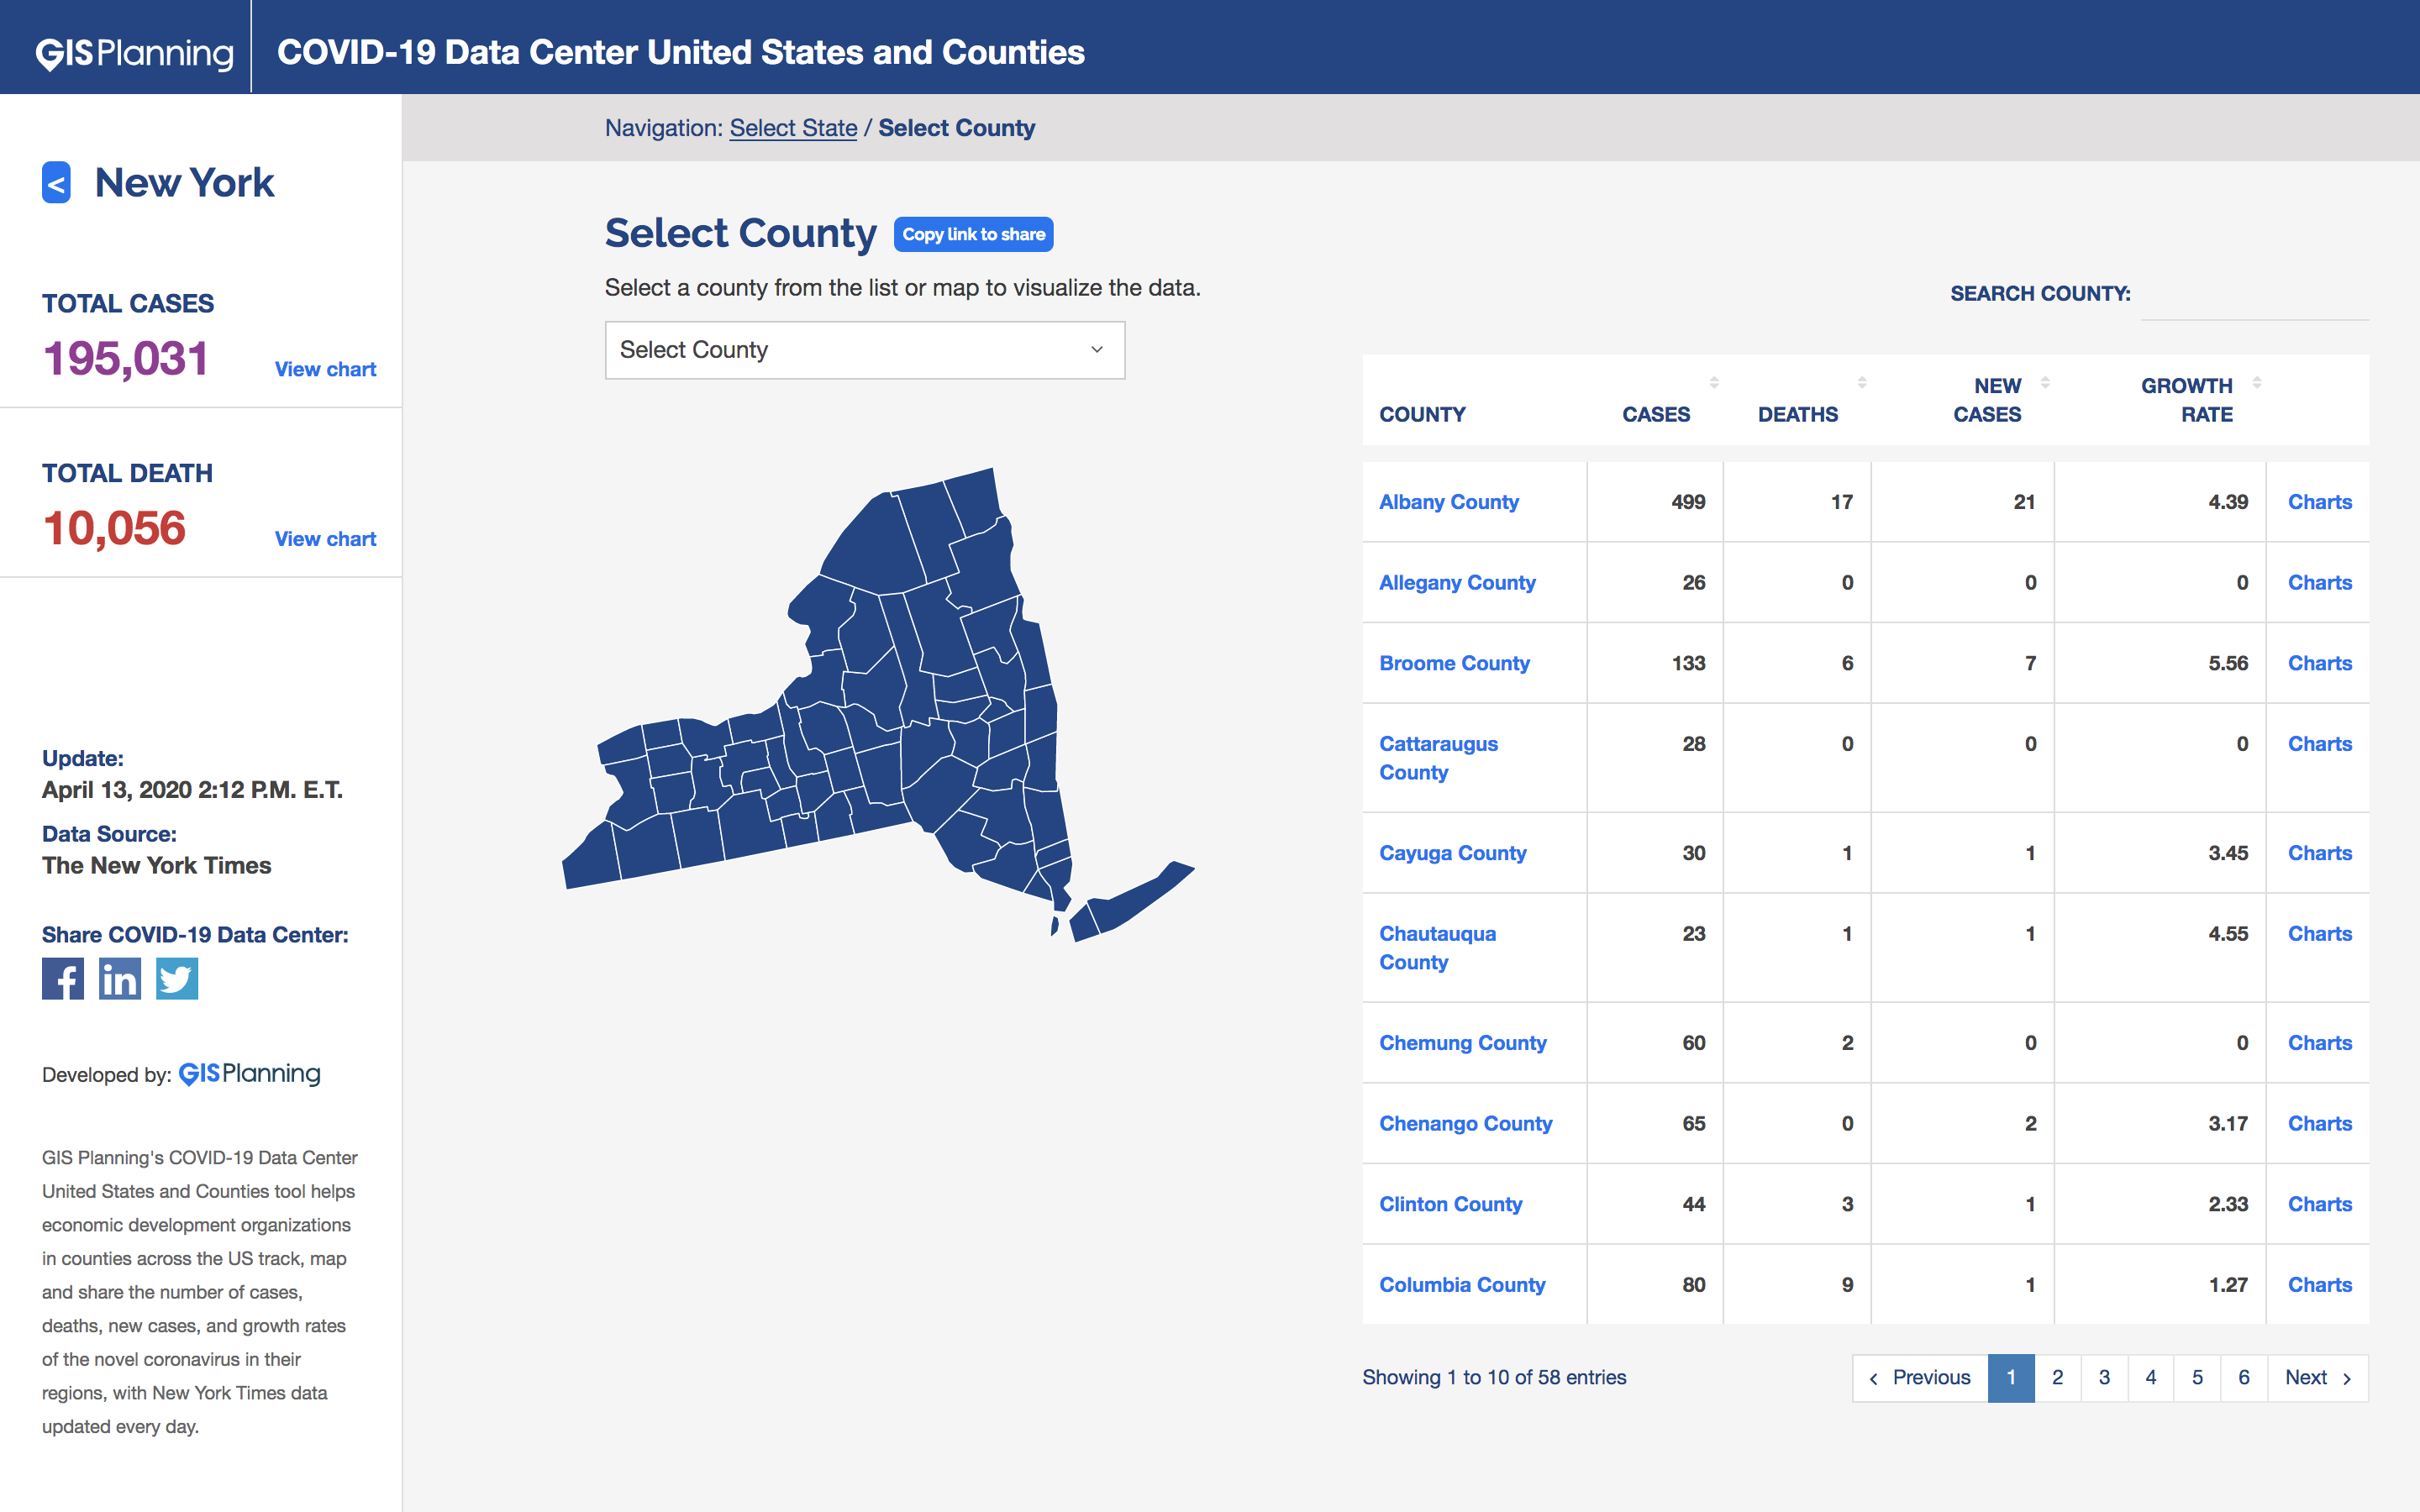
Users can choose any county within a state to view total cases, total new cases, total deaths, and total new deaths. All of the data can be exported and easily shared from the total directly to social media from the column on the left. The image below shows New York State selected, with the counties listed alphabetically; they can also be selected from the county dropdown list above the map. The total cases and total deaths number on the left adjusts to reflect data for that state.
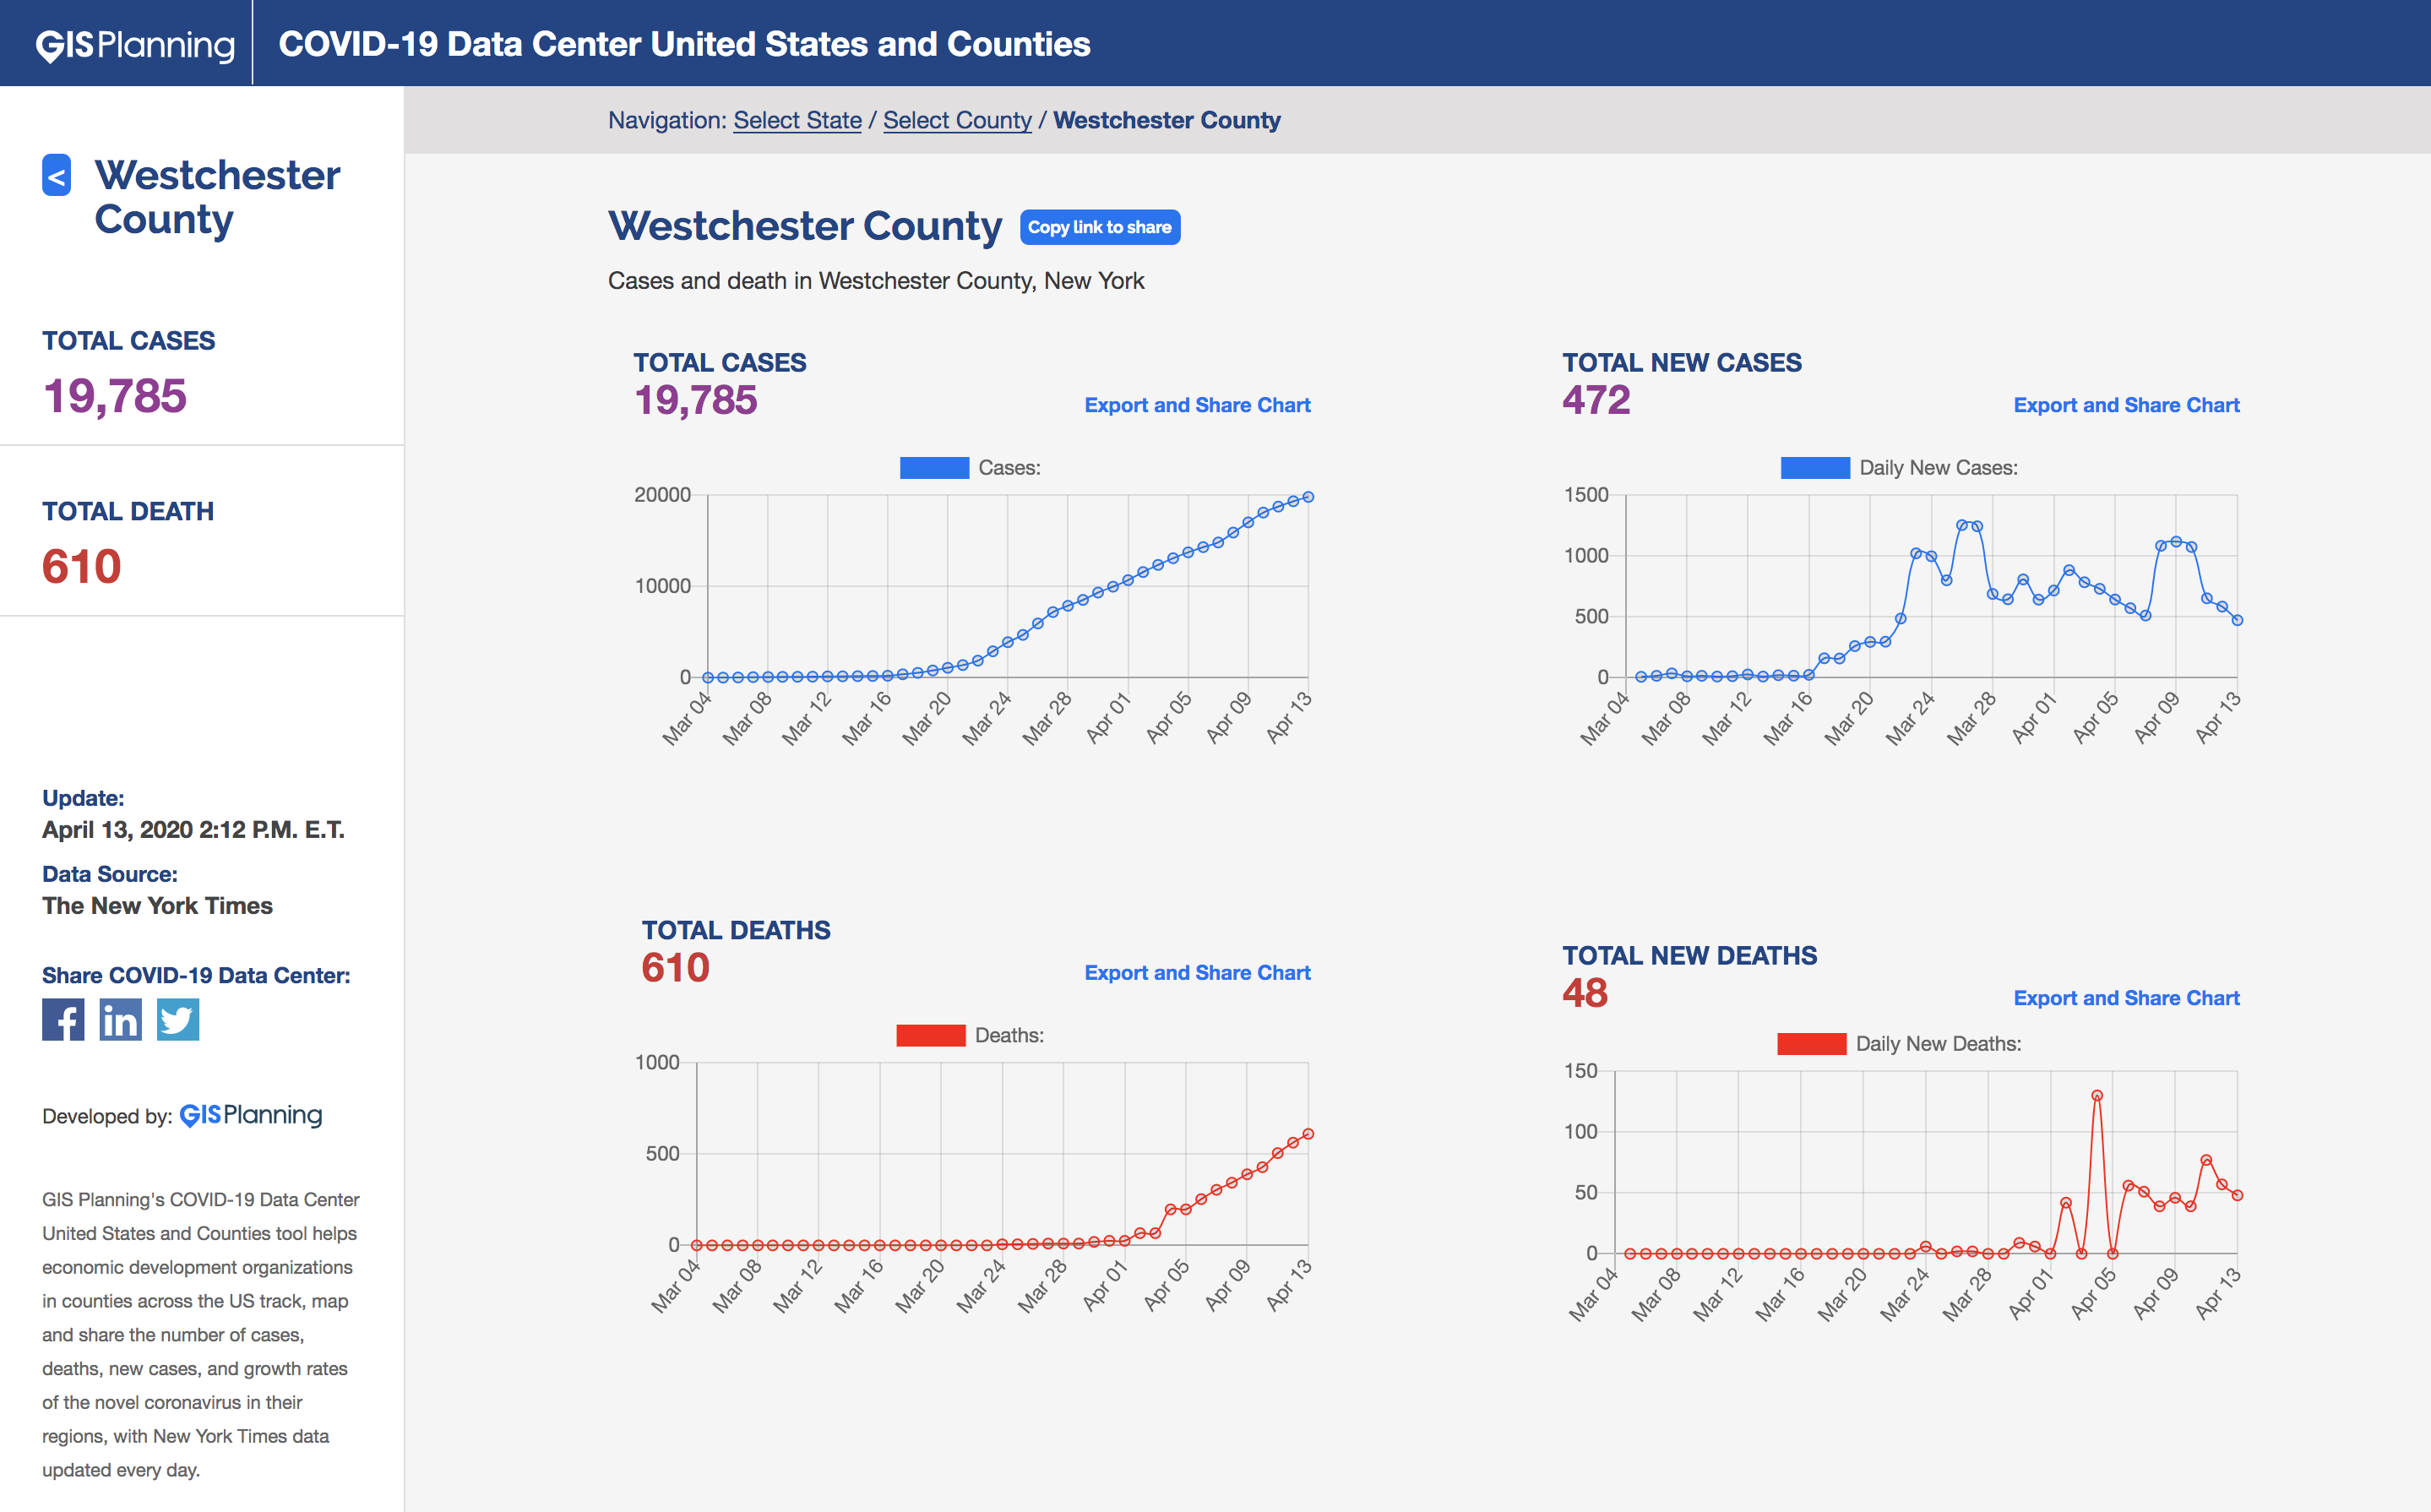
In the image below, you can see the chartsOPEN-ACCESS COMMUNITY DATA: HOW TO ACCESS THE GIS DATA YOUR REGION NEEDS RIGHT NOW displaying for the selected county. Each of the separate charts can be downloaded on their own for use in reports, email, on social media, in slide decks, etc. The link to the page for that county can also be generated by simply clicking on the blue button that says Copy Link to Share.
The GIS Planning COVID-19 Data Center for United States and Counties is one of several data tools and focused content we have rolled out since the onset of the pandemic. You can find more information about the other data tools and resources below:
- ZoomBusiness - Our newly released interactive mapping tool to list businesses open during the pandemic, available to all communities in the US and Canada. Simple to set up - your businesses enter their own data. Read more here.
- Free COVID-19 Mapping tool - Embed directly on any of your website pages. This tool is available for all communities across the US and includes the New York Times' data, Chmura's JobsEQ job Vulnerability Index, and AGS' newly released unemployment data.
- White Paper Download - Coronavirus: 10 Impacts on the Economic Development Profession & Solutions to Mitigate the Challenges
- Webinar video - 5 Social Media Strategies for Economic Development Outreach
- Webinar video - Working from home? Strategies, tips & practical advice for economic developers
- Webinar video - Online Collaboration: How to Use Our Drag and Drop Proposal Generator to Virtually Respond to RFIs
- Webinar video - Open-Access Community Data: How To Access the GIS Data Your Region Needs Right Now
Questions about these or other tools and resources? Click the button below to get in touch.

