Communicating economic development data in compelling and easy-to-digest formats can be a challenge. We all know too well how quickly one's eyes glaze over faced with rows and columns of text and numbers. Our wildly popular community profile infographics addressed this issue by packaging key data points in attractive, interactive formats, enabling the end user to search for the information they need.
Google Trends data confirms a sustained interest in the use of infographics to convey complex data and tell stories. This handy infographic about economic development infographics provides even more convincing information about the value of these graphics.
Our clients love the look and functionality of the infographics, whether embedded as a Community Profile report within ZoomProspector Enterprise, or a standalone Community Profile Intelligence Component (click for live examples). Best of all, since the data is automatically updated by GIS Planning, clients never need to worry their infographics will be out of date. As more and more communities used the tools, we began to hear for requests for more flexibility in how these sleek new reports, so that the sections could be separated and downloaded for newsletters, social media and reporting.
So that's exactly what we did. You can now use your data infographics in more ways than ever:
- Download individual infographic sections
- Export sections for marketing and reports
- Choose from 3 custom colors for Community Profile Intelligence Component
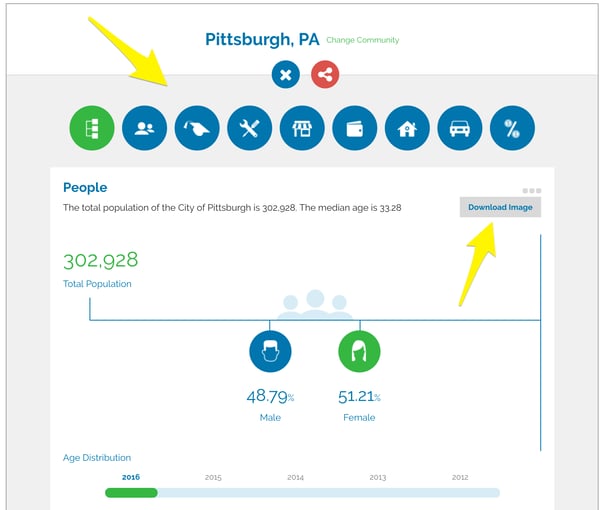
The screenshot below shows how easy and intuitive it is for your website users to select the sections of interest. the top arrow shows the different sections, and the bottom arrow shows where users can click on the three horizontal dots to download sections as PNG images.

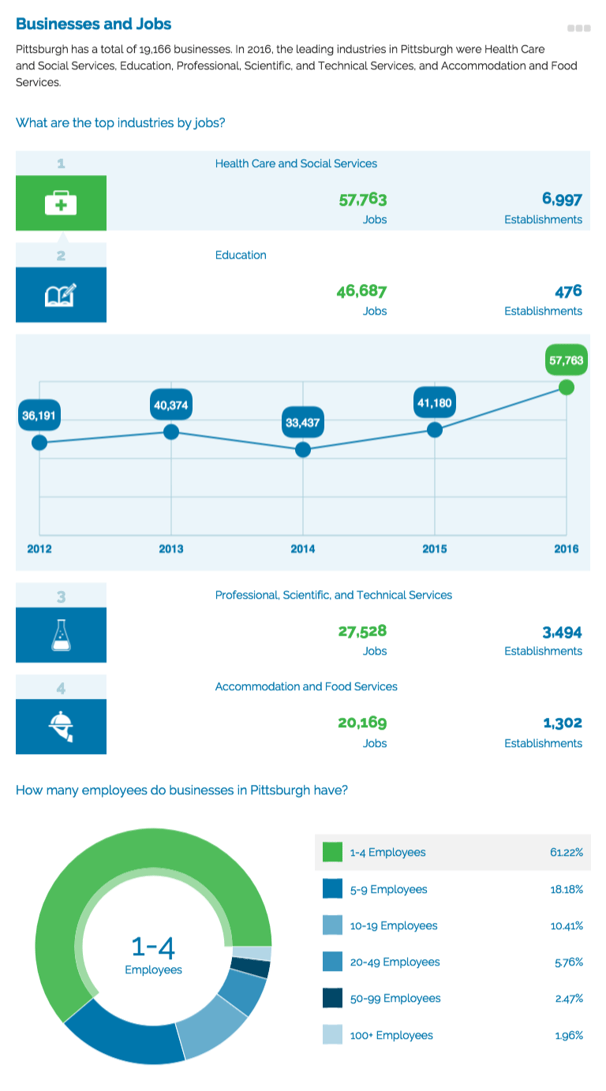
And the image below shows what the image looks like. This is the Business and Job section from the Pittsburgh. Of course, this downloaded image is static, so you can't engage with the data by selecting different industries to display totals, but a link to the original profile allows readers to go back to the source to do just that.

Want to know more about how Community Profile infographics can work to tell the story of your location to potential investors and businesses making location decisions? Click on the button below to get in touch!


