

The rapid spread of COVID-19 has completely disrupted the usual practice of economic development. GIS Planning remains fully open for business and here to help. Please do not hesitate to reach out and let us know if we can be of assistance during these difficult times. We're also acting quickly to help you get what you need to meet these challenges.
Map coronavirus impact on area employment
U.S. clients have the option to integrate, without additional charge, the new JobsEQ Economist Vulnerability Index on their ZoomProspector web tools. This is done with with ESRI ARcGIS - you can click on any county and see the data. This index, created by the Chmura team based on 2019 Q4 industry employment data, is a measurement of the negative impact that the coronavirus crisis can have on employment based upon a region's mix of industries. For example, accommodation and food services are projected to lose more jobs as a result of the coronavirus (in the neighborhood of 50%), compared to utilities and healthcare (with none or little expected job contraction). You can see it in the close up on the State of Kentucky ZoomProspector web tool below. Click the image to see it live on their site.
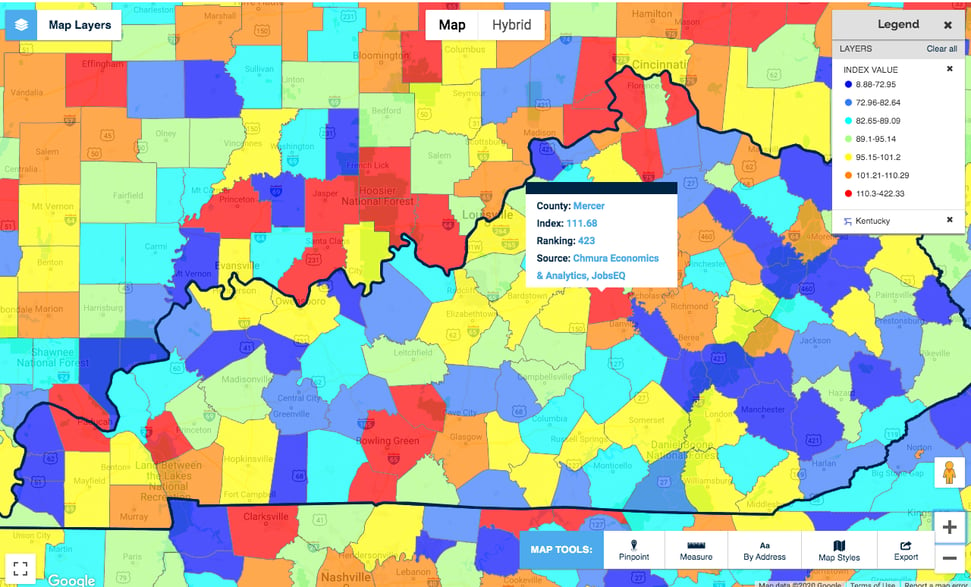
An average Vulnerability Index score is 100, representing the average job loss expected in the United States. Higher scores indicate the degree to which job losses may be greater — an index of 200, for example, means the rate of job loss can be twice as large as the national average. Conversely, an index of 50 would mean a possible job loss of half the national average.
The Vulnerability Index only measures the impact potential related to the mix of industry employment. The index does not take into account variation due to a regions' rate of virus infection, nor does it factor in local government's policies in reaction to the virus. For example, a region with a high Vulnerability Index may have little to moderate job losses if the region has only slight infection rates and local government imposes few restrictions. On the other hand, a region with a low Vulnerability Index may still incur large employment losses if the local rate of infection is high or local government restrictions are especially stringent. Please email support@gisplanning.com to learn more and to add it to your site.
Here's a recap of some other new ways we can add data layers - at no charge - to your GIS Planning web tools.
Add relevant local data layers
GIS Planning clients can quickly add local data layers to help their regions stay apprised of information relevant to the COVID-19 pandemic. EDOs can map essential services, businesses open or temporarily closed, restaurants offering delivery, testing centers, businesses participating in gift card stimulus programs and more. We can add this data free of charge to your ZoomProspector and Mapping Intelligence Component tools. You can read more about this here. To do this, we need data shared with us in spreadsheets or through a live connection with your internal GIS (we are compatible with ESRI and Google Maps). Please email support@gisplanning.com.
Emsi data by NAICS and by occupation code
We are proud to offer Emsi data by two-digit NAICS and occupation code to all full-edition U.S. ZoomProspector clients at no additional cost. This workforce data will be rolled out automatically to Canadian clients shortly as well. The data can be found under the Workforce tab at the top, and is fully mobile responsive. Search results can be exported to Excel spreadsheets. Clients who are also full subscribers to Emsi can integrate further amounts of detail. This new data set will be added automatically to your ZoomProspector tool and no additional action is required from your team.
![]()
A recap of additional GIS Planning resources related to the coronavirus crisis
Download our white paper
Coronavirus: 10 Impacts on the Economic Development Profession & Solutions to Mitigate the Challenges
Access these videos of recent webinars:
- Open Access Community Data: How to Access the GIS Data Your Region Needs Right Now
- Online Collaboration: How to use our drag and drop proposal generator to respond to RFIs
- Working from home? Strategies, tips & practical advice for economic developers
As always, please feel free to reach out to us with questions about GIS Planning products, to conduct an assessment of your region's economic development needs and to schedule a demo.

