

I'm looking forward to reconnecting with many clients at ICSC Las Vegas next week and it's got me thinking about the ways economic developers expend resources, time, and energy into promoting their locations to site selectors and expanding business. GIS Planning clients are at a tremendous advantage because they can really leverage the power of our data tools on the road.
To begin with, we provide useful insights via our free webinars, such as the one we did earlier this week with Lacy Beasley, president of Retail Strategies. Click here to review this webinar recording and learn about how the rapidly evolving retail space is such a vital sector for economic development. Next, I've put together some practical tips for using ZoomProspector, ZoomTour and our new CRM and investment attraction data visualization products to maximize your ICSC Las Vegas experience - or for any other trade show and conference your organization attends in the months to come.
Before the show
 Use the economic development CRM platform, Amplify, to plan your marketing campaign and line up meetings, calls, and other action items in the months/week leading up to the show
- If foreign direct investment (FDI) is an area of focus, you can use our FDI Markets, IncentivesFlow and fDi Benchmark data products to help formulate strategies, create effective messaging, and identify exciting retailers from around the world
- Start pushing consumer spending and demographics reports on your social media channels
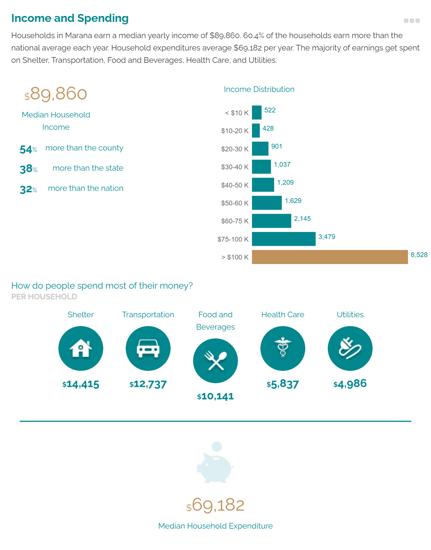
- Be strategic in your messaging and outreach: Pick a metric such as per household consumer spending for food out of the home or education level or family size. At right is an example from the Town of Marana Arizona
- You can also highlight specific properties in ZoomProspector with banners saying New, Featured, “Retail, etc.
LocatenCorona (CA) integrated a custom map layer showing their retail centers, making it easy to search for available retail properties within these centers - Send updates into social media feeds 2-3 times per week leading up to conferences and trade shows such as ICSC.
- Our Community Profiles Infographic offers high-level data with engaging and colorful visuals. Share the entire infographic or isolate and choose any one of the data blocks, such Age Distribution or Top 5 Industries.
- Use our Infographics and Maps to illustrate your emails, websites, and reports with value-added graphics
- Create landing pages on your website with specific data mapped out. It could be a heat map showing a specific demographic or consumer spending data point. Or you can use our Business Intelligence Component to show existing retailers. Our business data includes estimated sales and employee headcount, so you can provide a great overview of the business environment
- Choctaw Nations in Oklahoma embedded our Business Intelligence Component in web pages designed to show off their key industry sectors. Click here to see existing businesses in the Tourism sector mapped out. Click on any dot on the map to get company names, industry sector, and estimates of their headcount and sales
- Our new ZoomTour virtual tour platform enables you to create curated virtual tours of specific retail opportunities and showcase existing retailers in key sectors
At the show
- Print out our Consumer Spending and Demographics reports and bring them with you to the show
- Map out all the retail opportunities in your region
- You can show off our tabular, pie and bar chart reports, which really pop in color
- Bring a large screen monitor or laptop for your booth at the show, set it up so you have solid internet access (you can tether to your cell phone hotspot if necessary) and have your ZoomProspector site up to show off key data and available properties
- Show prospects specific properties, or pull up reports/maps on the fly, and email them to your prospects right then and there
- Continue updating your social media feed throughout the show. Prepare posts based on ZoomProspector reports and maps (with links back to your web tool) on your Facebook, LinkedIn and Twitter feeds. Or link to a ZoomTour of retail opportunities or to show off your retail corridors
- Use trade show hashtags such as #ICSCLasVegas strategically to ensure attendees follow your posts
After the show
- This is where our back-end analytics really shine. With Lead Gen ID, we enable you to “see” which companies are hitting your ZoomProspector site and the precise criteria specified in searches. You can see which sites and buildings as well as reports they are looking at, as well as if they email colleagues reports from within ZoomProspector, you will know which specific companies (many or all of whom you met at ICSC!) are following up with you proactively
- You can follow up with them by reaching out to see if they need additional assistance, sending links to custom heat maps, or emailing property and data reports as needed, based on what you learn from your analytics
- You can also create and send proposals using ZoomProspector’s backend Proposal Generator which enables you to combine the vast property and community (public) data ZoomProspector provides additional custom content (incentive offers, a welcome video from your Mayor etc.).
Want to learn more about how GIS Planning's suite of innovative data-driven tools can help drive investment to your community? Schedule time with me at the link below.