

We're looking forward to reconnecting with many clients at ICSC ReCon in Las Vegas in a few weeks and it's got me thinking about the ways economic developers expend resources, time, and energy into promoting their locations to site selectors and expanding businesses. ZoomProspector Enterprise clients are at a tremendous advantage because they can really leverage the power of those data tools on the road.
With that in mind, I've put together some practical tips for using ZoomProspector Enterprise to maximize your ReCon (and other trade shows) experience. Matt Z. Ruszczak, executive director of the
Rio South Texas Economic Council explains how he makes consistent use of his online data tools when he and his team head out on the road: “At trade shows, ZoomProspector’s site analytics are not only a great tool for facilitating on-the-spot site-specific in-depth conversation with leads, the visually appealing exported demographic & market reports lend themselves for in-booth displays, attracting passer-by traffic to stop, look, and converse.”
Click on the links to see examples from live client websites, which can be easily exported and shared.
Before the show:
 Start pushing consumer spending and demographics reports on your social media channels
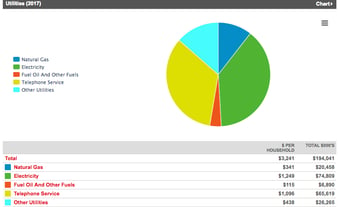
- Be strategic: pick a metric such as Per Household consumer spending for food out of the home, or Education level, or size of family.
- You can also highlight specific properties in ZoomProspector Enterprise with banners saying “New”, “Featured”, “Retail” etc
- Send updates into social media feeds 2-3 times per week leading up to ReCon.
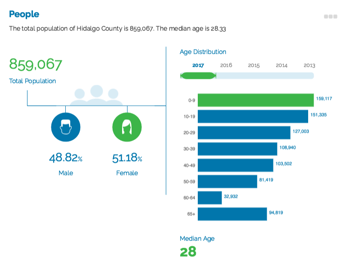
- Our Community Profiles Infographics offer high level data in with engaging, colorful visuals. Share the entire infographic or isolate and choose any one of the data blocks, such Age Distribution or Top 5 Industries.
- Use our Infographics and Maps to illustrate your emails, websites and reports with value-added graphics
- Create landing pages on your website with specific data mapped out. It could be a Heat Map showing a specific Demographic or Consumer Spending datapoint. Or you can use our Business Intelligence Component to show existing retailers. Our Business data includes estimated Sales and Employee headcount, so you can provide a great overview of the business environment.
At the show
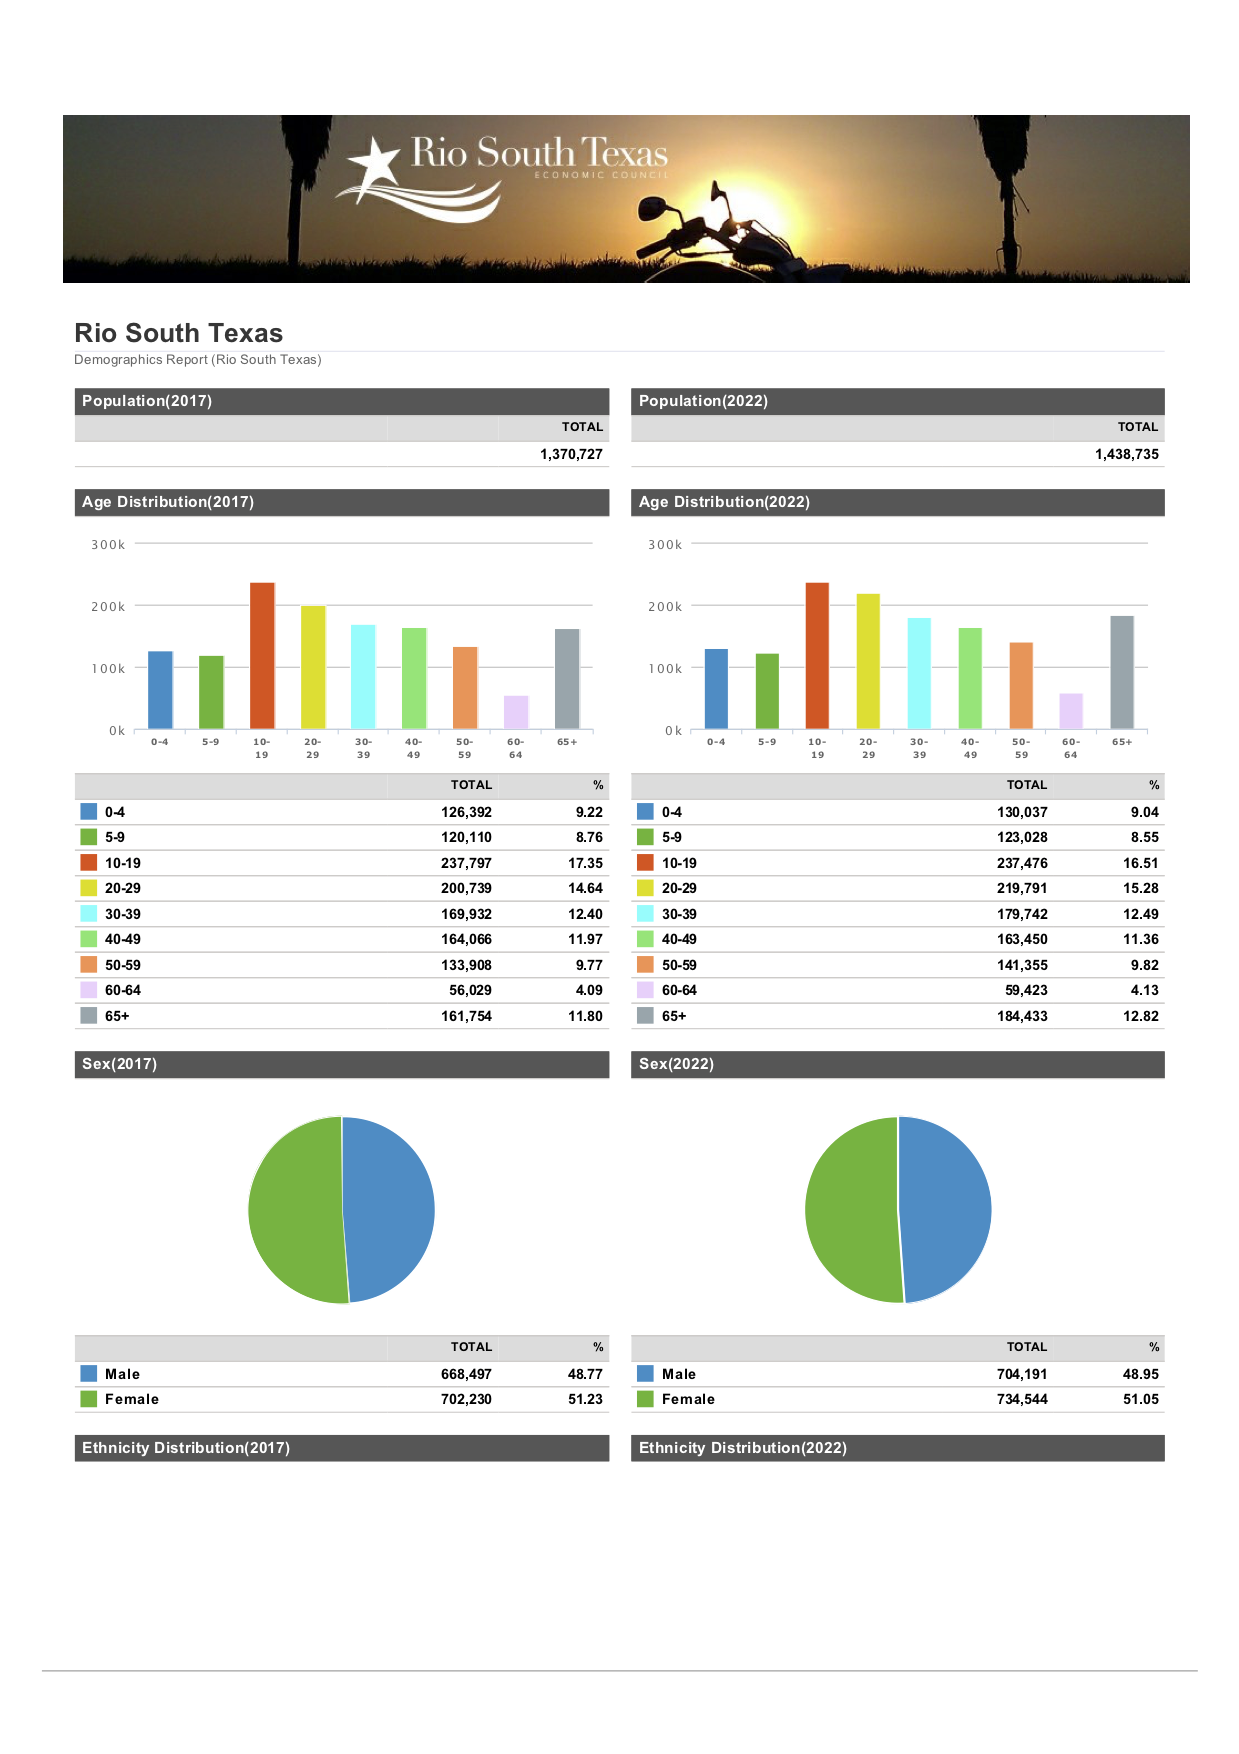
 Print out our Consumer Spending and Demographics reports and bring them with you to the show. See the image below for an example from the reports on the Rio South Texas Economic Development Council website, shared by Executive Director Matt Z. Rusczczak.
 - You can show off our tabular, pie and bar chart reports, which really pop with a good color printer.
- Bring a large screen laptop with you to the show, set it up so you have solid internet access (you can tether to your cell phone hotspot if necessary) and have your ZoomProspector site up and ready to go.
- Show prospects specific properties, or just pull up reports/maps on the fly, and email them to your prospects right then and there.
- Continue updating your social media feed.Feel free to include more ZoomProspector reports and maps on your FaceBook, LinkedIn and Twitter feeds. Use trade show hashtags such as #ICSCReCon strategically to ensure attendees follow your posts.
After the show
This is where our back end analytics really shine. With Lead Gen ID, we enable you to “see” which companies are hitting your ZoomProspector site and the precise criteria specified in searches. You can see which sites and buildings as well as reports they are looking at, as well as if they email colleagues reports from within ZoomProspector Enterprise, you will know the specific individuals (many or all of whom you met at ReCon!) are following up with you proactively.
You can follow up with them by reaching out to see if they need additional assistance, sending links to custom heat maps, emailing property and data reports as needed.
Want to know more about how ZoomProspector Enterprise and our Intelligence Components can help you market your location. Click the link below to schedule your own customized demo.

